Email Health Chk guide
~ getchk / docs / email-health-chk
Email Health Chk analyzes the public email setup of any domain: how it authenticates its mail (SPF, DKIM, DMARC), how its mail servers handle TLS, whether their addresses are on blocklists, and the DNS records around them. It runs inside WordPress and puts a free tool on your site. A visitor types a domain and sees the result in seconds. If they want more, they confirm their email with a code and get a written report with the fixes, on screen and as a PDF in their inbox.
| For the visitor | a clear answer about their own domain, sorted by severity, with the exact DNS records to publish. |
| For you | a qualified conversation. Someone who just learned that their DMARC only monitors has a problem you can solve. Their address is saved as a lead, and you can get an alert. |
| Honest results | when a check cannot be completed, the tool says so. A failed lookup is never shown as a clean result. |
This guide follows the plugin menu, Email Health Chk, screen by screen. Start with First steps.
First steps
This is the short path, in order. Each step links to the section that explains its screen in full.
What your server needs
- WordPress 5.8 or newer and PHP 7.4 or newer.
- Outbound DNS lookups from the server (TXT, MX, A and the rest). The whole analysis depends on them.
- Outbound connections on port 25 for the mail server checks (STARTTLS and the certificate). Many hosting and cloud providers block that port: the rest of the analysis still runs.
- WordPress able to send email (the verification codes and the reports go out by email).
Put the tool on a page Required
Create or edit a page and add the shortcode [email_health]. Publish it. That is enough for the free analysis. See The tool on your site.
Connect an AI provider (required for the report)
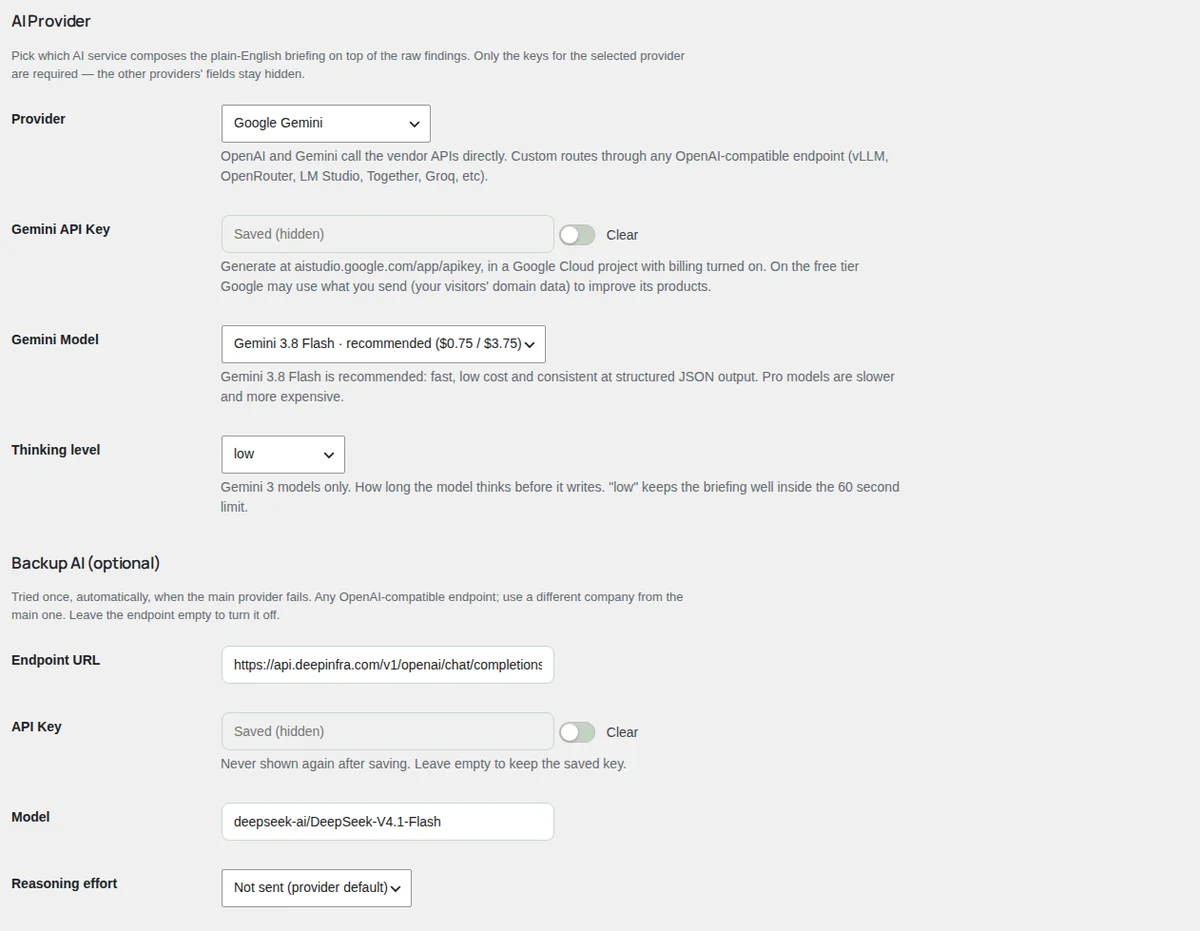
The analysis works without AI. The written report does not: without an AI key, a visitor who asks for it gets an error. In Email Health Chk > Settings, under AI Provider, pick Google Gemini, OpenAI or an OpenAI-compatible service and paste its key. See AI provider.
Check it is protected
Without a check against bots, anyone can script your tool and spend your AI credits and your server time. The built-in check is on with nothing to set up; if you prefer Cloudflare Turnstile, choose it in Settings and paste its two keys. See Cloudflare Turnstile.
Decide how the report travels Recommended
The report goes by email as a PDF made by Gotenberg, a converter you host yourself. Set its address in Settings > Gotenberg, or switch the attachment to HTML in Email Reports if you cannot run it. In Email Reports, also put your name, logo and colors on the PDF and, if you want, your own SMTP server. See PDF with Gotenberg and Email Reports.
Check the addresses people give you Recommended
In Email Verification, add a Reoon or Emailit key so the plugin confirms that an address is real before it sends a code or a report to it. See Email Verification.
Hear about new leads Optional
In Notifications, turn on an email alert or a webhook (Microsoft Teams works too) for each new lead or critical finding. See Notifications.
Sell your help Optional
In Sales Pitch, write the card that offers your services after the results, in the report email and in the PDF. See Sales Pitch.
Make it yours Optional
Colors and texts of the tool in Customize Widget, the dark Console look in Settings > Widget Style, a floating button on every page in Settings > Global Popup / FAB, terms and a usage limit in Settings. See Customize Widget, Floating button, Terms and conditions and Usage wall settings.
Check that everything is green
Open Email Health Chk > Plugin Info. The Subsystem Status tiles show what is configured and what is not. Then analyze a domain you know on your page and ask for its report with your own email. See Plugin Info.
The tool on your site
The tool is a shortcode. Put it on any page, post or widget area that accepts shortcodes. It needs no theme changes.
| Shortcode | What it shows |
|---|---|
[email_health] | The full analyzer: a domain field, the results by section and, on top of the results, the offer of the written report. Same as [email_health mode="dashboard"]. |
[email_health mode="briefing"] | Only the report form: domain and email, the code, and the report. For a focused landing page without the analyzer. |
You can also show the report form on every page with a floating button, without a shortcode. See Floating button.
What the visitor does
- Types a domain, such as
example.com, and presses "Analyze". A web address or an email address also works: the tool keeps only the domain. If you turned on Turnstile or the terms, those appear under the field. - Waits a few seconds while the loading text shows. The analysis usually takes 10 to 20 seconds.
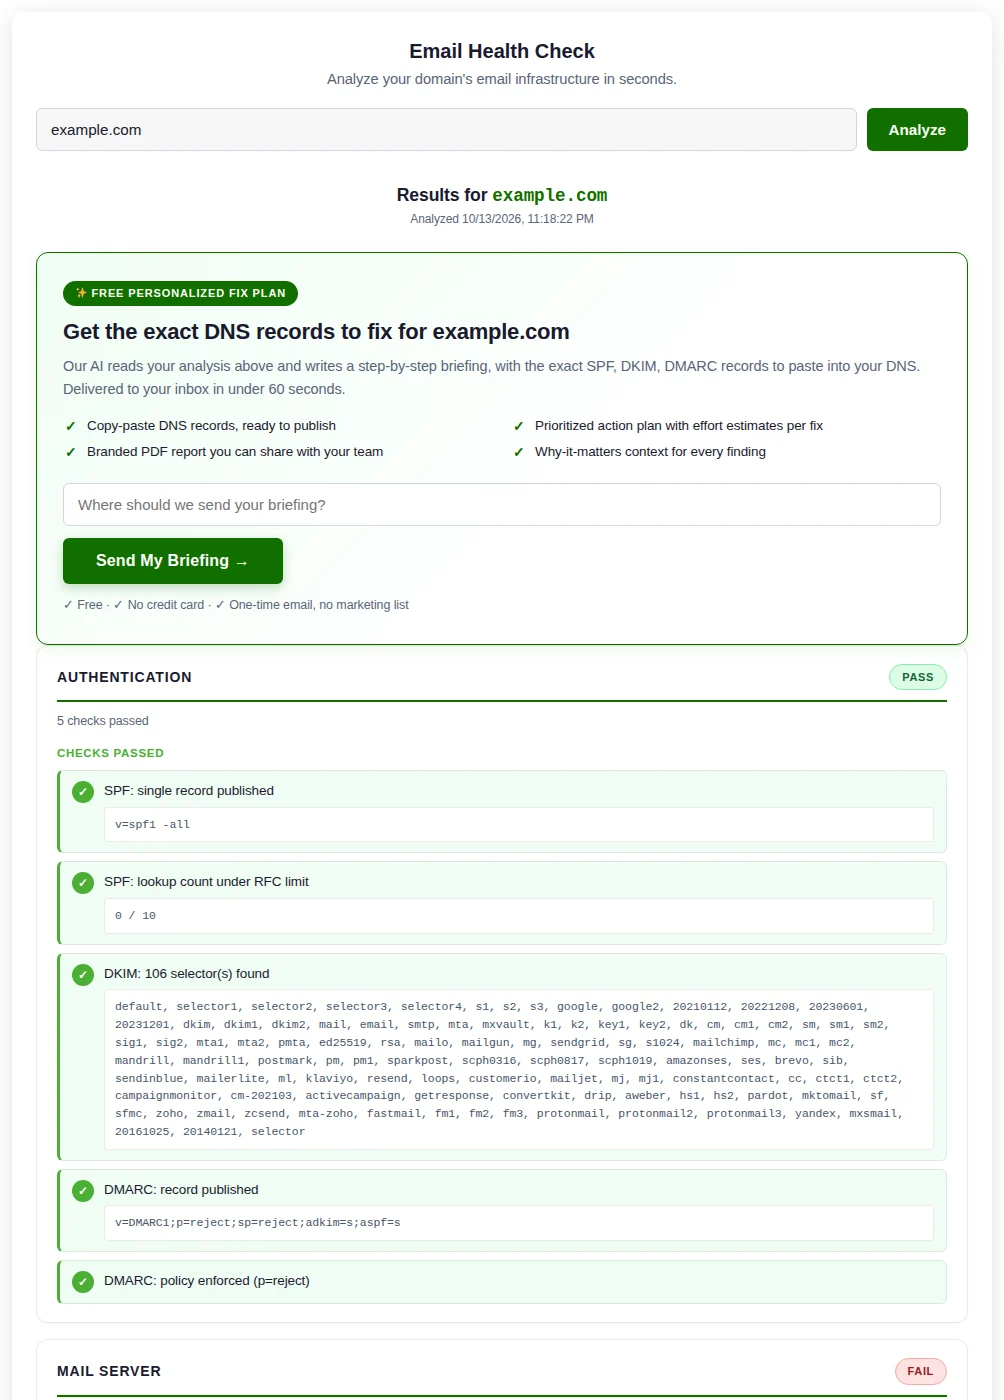
- Reads the result under "Results for" and the domain, with the date and time of the analysis.
The result
The findings are grouped in five sections, in this order: "Authentication", "Mail Server", "DNS Hygiene", "Blacklists" and "Web Server". A section with nothing to report is left out. Each section has a status badge:
- PASS: every check in it passed.
- INFO: only advanced or optional improvements, the kind many large sites do not deploy.
- WARN: at least one medium issue.
- FAIL: at least one critical or high issue.
Each finding carries its severity ("Critical", "High", "Medium" or "Low") and an explanation. Low findings are also marked "Advanced". Under the problems, each section lists the checks that passed, with their evidence.
When a lookup fails, the finding says so ("DNS lookup failed", "RBL check incomplete") instead of reporting the record as missing or the address as clean. Ask the visitor to run the check again a moment later.
The offer of the report
On top of the sections, a card titled "Get the exact DNS records to fix" offers the written report: four short benefits, an email field and the "Send My Briefing →" button. If you set up a Sales Pitch in inline mode, its card also appears here, above the sections. What happens next is explained in The report.
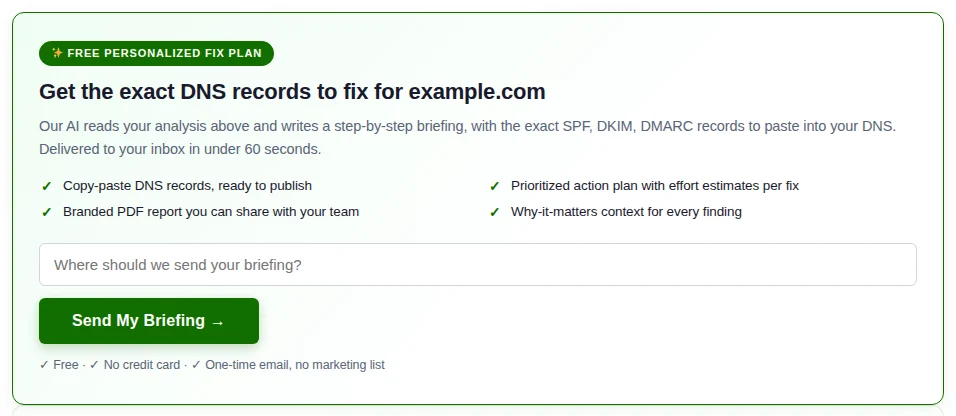
The report form on its own
With [email_health mode="briefing"] (and in the floating button), the visitor sees three steps:
- "AI Briefing": the domain, their email, the terms if you turned them on, and "Send code".
- "Confirm your email": the 6-digit code, "Verify and generate briefing", "Resend code" and "Back".
- The report on screen, with "Download as HTML" (a copy for the visitor's computer) and "Analyze another domain".
Under the tool
Under the tool, a small line reads "A tool by Digital Checkmark", with a link to digitalchk.com. It has no setting. If Leads Chk is installed and you chose a form for this tool, its newsletter form appears under the line.
What it checks
Every analysis runs these checks against public DNS and the domain's own servers. Nothing is sent to the domain owner.
| Section | Checks |
|---|---|
| "Authentication" | SPF present and unique, SPF lookups against the limit of 10, void lookups, include chains that do not resolve, include loops, DKIM selectors found, DMARC present and its policy, DMARC delegated by CNAME |
| "Mail Server" | MX records, the SMTP banner and its PTR, STARTTLS, the TLS certificate (dates, expiry, name match, issuer), MTA-STS, TLS-RPT |
| "DNS Hygiene" | DNSSEC (DNSKEY records), CAA records, BIMI |
| "Blacklists" | Every IP of the mail servers against the blocklists enabled in Settings > RBL List |
| "Web Server" | A and AAAA records and whether the domain answers over HTTPS |
How far it goes
- Mail servers: up to 5 MX hosts by priority, and 30 seconds in total for the SMTP and TLS connections. Hosts left when the time runs out are skipped. Change both in Settings > Rate Limits. See Rate limits.
- DKIM: DKIM has no public index of selectors, so the tool tries a list of well-known ones (Microsoft 365, Google Workspace, Mailchimp, SendGrid, Amazon SES and many more). A domain that signs with an unusual selector shows "No DKIM detected" even if it signs. Add your selectors in Settings > DKIM Selectors.
- Blocklists: only IPv4 addresses are checked. Spamhaus, CBL and a few others refuse queries that come through public DNS resolvers. When your server uses one, the tool says those lists were not queried, and why, instead of reporting the IP as clean.
A failed lookup is never a clean result. When a DNS lookup fails, a blocklist does not answer or a DKIM selector cannot be read, the finding says the check could not be completed and asks to run it again. A naive tool would say "not listed" or call the record missing, and the visitor would believe something that nobody checked.
Severity
| Severity | Meaning |
|---|---|
| "Critical" | Directly breaks delivery or allows spoofing. Fix it now. |
| "High" | Significant impact on delivery or sender reputation. Fix it within days. |
| "Medium" | Moderate impact. Recommended, not urgent. |
| "Low" | An advanced or optional improvement. Many large sites do not deploy it. Marked "Advanced". |
The report
The report is the written version of the analysis: what is wrong, why it matters, the exact DNS record that fixes it and an ordered plan. An AI writes it from the findings. The visitor sees it on screen and gets it by email. To get it, they confirm their address with a 6-digit code.
The visitor asks for it
Under the results, the visitor writes their email and presses "Send My Briefing →" (in the report form on its own, "Send code"). Before sending anything, the plugin checks, in this order:
- The per-minute limit for this visitor and, if you set it up, Turnstile. See Rate limits and Cloudflare Turnstile.
- The terms, when you made them required. See Terms and conditions.
- Your address rules, the list of disposable email services and whether the domain of the address accepts mail. See Allowed emails.
- Reoon or Emailit, if you turned them on for Briefing requests. See Email Verification.
If an address fails, the visitor sees why (for example "Please use a non-disposable email address.") and nothing is sent.
The code arrives
The visitor gets an email with the subject Your Northwind Dental verification code: 123456, where the company is the Name of your Sales Pitch or, without it, your site name. The code:
- lasts 10 minutes and works once;
- locks that address for 15 minutes after 3 wrong attempts ("Too many attempts. Try again in 15 minutes.");
- can be sent up to 5 times per hour to one address and 5 times per hour from one visitor, unless you change it in Settings > Rate Limits.
The visitor has 15 minutes between asking for the code and typing it. After that, they start over.
The report is written
The visitor types the code and presses "Verify & Generate" ("Verify and generate briefing" in the form on its own). The plugin analyzes the domain again, the AI writes the report, and the result shows on the page in 15 to 30 seconds. If the main AI fails and you set a backup AI, the backup tries once.
The on-screen report has the overall state, "What we found" with each problem and its evidence, the DNS record to publish ("Type", "Host" and "Value"), and the "Action plan" with an effort estimate per step. It ends with your Sales Pitch card if you turned it on, or with the AI's "Ready to fix this?" paragraph if not (you can turn that paragraph off in Email Reports).
The email with the PDF
At the same time, the visitor gets the email Your Email Health Briefing for example.com with the report attached as a PDF (or as an HTML file, if you chose that in Email Reports). The email repeats your Sales Pitch card when it is on.
The PDF carries your cover (logo, company name, tagline and colors), a table of the findings, the detailed findings with the records to publish, the action plan, your Sales Pitch or the AI closing, and an appendix with every record and probe result of the analysis. The foot of every page carries your footer text and the line "A tool by Digital Checkmark".
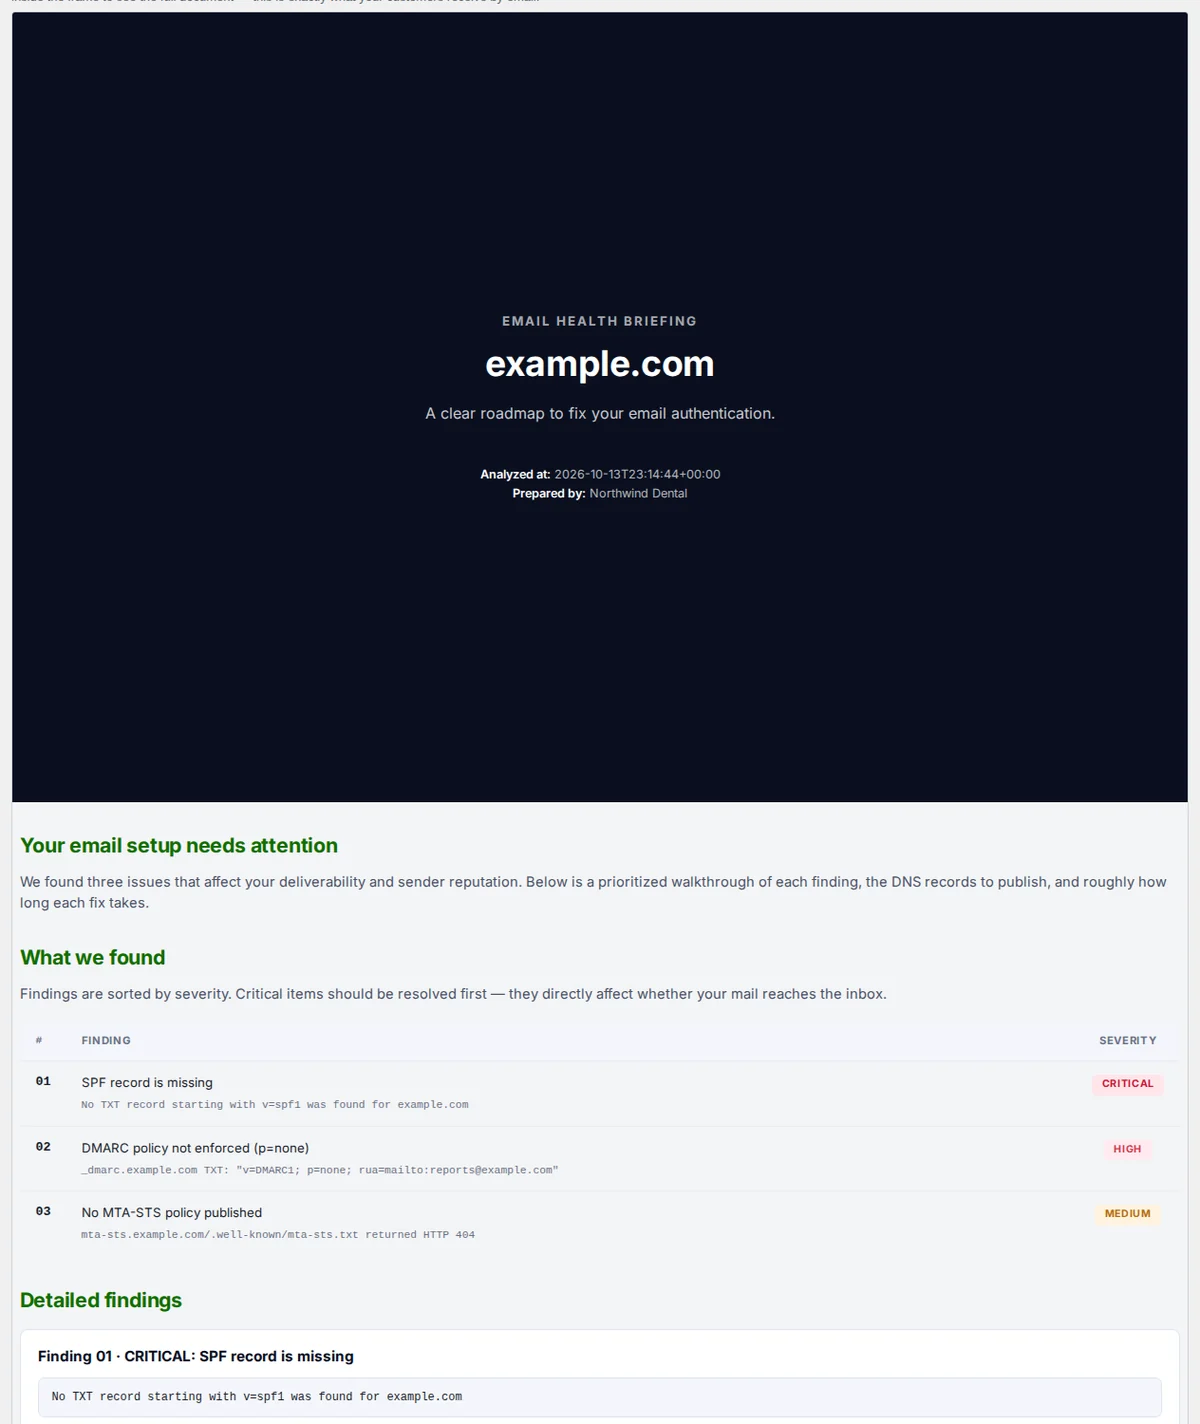
Every DNS record in the report is written by an AI. Each one is labeled "AI-generated suggestion. Validate before publishing in your DNS." Leave that label in place, and check the syntax and the host of a record before you publish it.
What you get
When the report is sent, and Lead capture is on, the address is saved in Leads with the domain and the number of findings by severity. Your Notifications fire, and Leads Chk receives the contact if it is installed. The visitor's IP is also freed from the usage wall for 24 hours.
If the PDF cannot be made (Gotenberg is down, for example), the visitor still sees the full report on screen, but no email goes out. Turn on the Debug Log to see why. See If something does not work.
The usage wall
The usage wall lets a visitor run a few analyses for free and then asks for an email to keep going. It is off until you turn it on in Settings > Usage Wall. See Usage wall settings.
What the visitor sees
- They analyze domains as usual. Each analysis counts against their IP address.
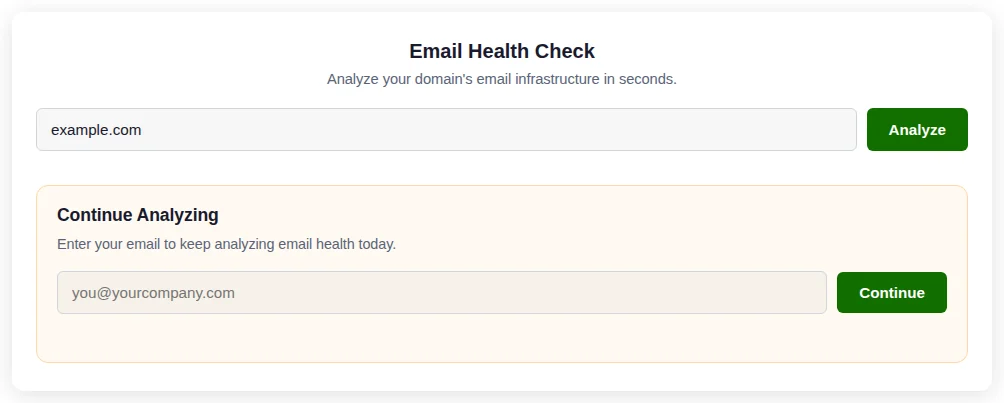
- When they reach your daily limit, the next analysis shows the wall instead of the result: your heading, your text, an email field and your button. Without your own texts, the wall reads "Daily limit reached" and "Continue".
- They type their email and press the button. The plugin checks the address like any other (your rules, disposable services, MX and, if you turned it on for the wall, Reoon or Emailit) and sends a 6-digit code.
- A code field and "Verify" appear. When the code is right, the wall says "Unlocked. Re-running analysis..." and the analysis they asked for runs.
What happens behind it
- Unlocking the wall is the same as asking for the report: the AI writes the report for the domain, the visitor gets it by email, and the address is saved as a lead with the source
usage_wall. That is why the wall needs a working AI provider. - That IP is free from the wall for 24 hours. Without unlocking, the count of analyses resets 24 hours after the last analysis that counted.
- A visitor who asks for the report through the card under the results also frees their IP for 24 hours.
Languages
The plugin comes in English and Spanish and follows the language of the page. On a multilingual site, a visitor who reads the Spanish page gets the tool, the verification code, the on-screen report, the email and the PDF in Spanish, and the AI writes the report in that language.
Your own texts
The texts you write in the settings (the tool's title and button, the usage wall, the floating button, the terms, the Sales Pitch and the PDF tagline) are registered with Polylang. Translate them in Languages > Translations, group Email Health Chk. When you change one of those texts, translate it again there.
The three messages of Allowed emails work the same way: leave them empty to use the built-in text, already translated. See Allowed emails.
Most of the plugin's admin screens are in English only, also on a Spanish site. The parts the visitor sees are fully translated.
Settings
Email Health Chk > Settings is the main screen. It opens when you click the plugin in the menu. At the top, a reminder shows the shortcode [email_health] and links to Plugin Info.
The screen is one long form, split into blocks. Each block has its own section in this guide:
| Block | What it does | Section |
|---|---|---|
| AI Provider and "Backup AI (optional)" | The AI that writes the report, and a second one for when it fails | AI provider |
| Gotenberg | The converter that turns the report into a PDF | PDF with Gotenberg |
| Cloudflare Turnstile | The check against bots: built-in check, Turnstile or none | Cloudflare Turnstile |
| Rate Limits (per minute) | How often a visitor can use the tool, and how far the analysis goes | Rate limits |
| Check Scope, RBL List, DKIM Selectors | What the analysis looks at | Check scope, RBL list and DKIM selectors |
| Lead Capture | Saving the addresses, and for how long | Lead capture and retention |
| Widget Style | The Standard or the dark Console look | Widget style |
| Terms & Conditions | A consent box before the tool | Terms and conditions |
| Usage Wall | Free analyses per day before asking for an email | Usage wall settings |
| Global Popup / FAB | A floating button on every page | Floating button |
| Debug | The switch of the debug log | Debug Log |
Saving
One Save Changes button at the bottom saves the whole form. Change what you need in any block and press it once.
Keys and passwords
Fields that hold a secret (the AI keys, the Turnstile secret key, the Gotenberg password) are never shown again after you save them. The empty field reads "Saved (hidden)":
- Leave it empty to keep the saved value.
- Type a new value to replace it.
- Tick "Clear" next to it and save to delete it.
AI provider
The AI writes the report: it reads the findings of the analysis and returns the explanations, the DNS records to publish and the action plan. The free analysis on the page does not use it. The report, and with it the usage wall, does: without a working provider, a visitor who asks for the report sees "The analysis service is not configured. Please contact the site administrator."
The data sent to the AI is the public DNS data of the domain analyzed, the same data anyone can look up.
Choose the provider
In Email Health Chk > Settings > AI Provider, pick the Provider. Only the fields of the provider you pick are shown.
| Provider | What to fill in | Default |
|---|---|---|
| Google Gemini | Gemini API Key, Gemini Model and "Thinking level" | The provider chosen on a new install |
| OpenAI | OpenAI API Key and OpenAI Model | | |
| Custom (OpenAI-compatible) | Custom Endpoint URL, Custom API Key and Custom Model | Any service with a Chat Completions API: OpenRouter, Groq, Together, vLLM, LM Studio and similar |
Get a Gemini key
- Open aistudio.google.com/app/apikey and sign in with a Google account.
- Create an API key in a Google Cloud project with billing turned on. On the free tier, Google may use what you send (your visitors' domain data) to improve its products.
- Copy the key. It starts with
AIza.
Get an OpenAI key
- Open platform.openai.com/api-keys and sign in.
- Create a secret key and copy it. It starts with
sk-. Use is billed to your OpenAI account.
Paste it and choose the model
- Paste the key in its field.
- Pick the model. The list marks the recommended one for each provider: Gemini 3.8 Flash and GPT-5.4 Mini. Pro and flagship models are slower and cost more, and the report has 60 seconds to be written.
- With Gemini 3 models, leave "Thinking level" in
low(the value on a new install) to keep the report well inside the 60 seconds. "Google default" lets Google decide. - Press Save Changes.
To check it, ask for a report on your page with your own email. If it fails, open the Debug Log.
A custom service
- In Custom Endpoint URL, paste the full chat completions address, ending in
/v1/chat/completions(for examplehttps://openrouter.ai/api/v1/chat/completions). Addresses on private networks are refused. - In Custom API Key, paste the key. The plugin sends it as a Bearer token. It needs one: without a key, the plugin treats the service as not configured.
- In Custom Model, type the exact model name the service expects (for example
meta-llama/llama-3.3-70b-instruct).
Backup AI
"Backup AI (optional)" is a second service that is tried once, on its own, when the main provider fails (an error, a timeout, a reply that is not valid). Use a service from a different company than the main one. It must have a Chat Completions API.
- In "Endpoint URL", paste its chat completions address (for example
https://api.deepinfra.com/v1/openai/chat/completions). - In "API Key", paste its key. It is never shown again after saving: leave the field empty to keep it.
- In "Model", type the model name.
- In "Reasoning effort", leave "Not sent (provider default)" unless the model needs it.
The backup only runs when all three (address, key and model) are filled in, and only if the main provider failed within its first 40 seconds. Leave "Endpoint URL" empty to turn the backup off.
PDF with Gotenberg
The report travels by email as a PDF. The plugin builds the report as a web page and sends it to Gotenberg, a free converter you run yourself, which returns the PDF. Without Gotenberg, the report still shows on screen, but the email is not sent, unless you switch the attachment to HTML (see below).
Run Gotenberg
Gotenberg runs as a Docker container. On the same server as WordPress, or on another machine your server can reach:
docker run -d --restart unless-stopped -p 127.0.0.1:3000:3000 gotenberg/gotenberg:8
That publishes it only on the machine itself, at http://127.0.0.1:3000. If it runs on another machine, put it behind HTTPS and a password, or on a private network.
Connect it
- Open Email Health Chk > Settings > Gotenberg.
- In Service URL, paste its base address, for example
http://127.0.0.1:3000. Only the base: the plugin adds the conversion path. Use a plainhttporhttpsaddress, without a user or password inside it. - If your Gotenberg asks for a password (basic authentication), fill in Basic Auth User and Basic Auth Password. The password is never shown again after saving.
- Press Save Changes.
Check it
Open Email Health Chk > Plugin Info. The Gotenberg tile says Reachable when its health address answers, Unreachable when it does not, and Not configured with no address. The answer is kept for 5 minutes, so wait a little after a change. Then ask for a report with your own email and look for the PDF.
Without Gotenberg
On shared hosting, where you cannot run a container, go to Email Reports > Report options and set Attachment format to HTML (no converter needed). The same document goes as an .html file. Many mail gateways quarantine or strip .html attachments, because they are a common way to deliver phishing, so the report may not arrive. Prefer the PDF whenever you can run the converter. See Email Reports.
Cloudflare Turnstile
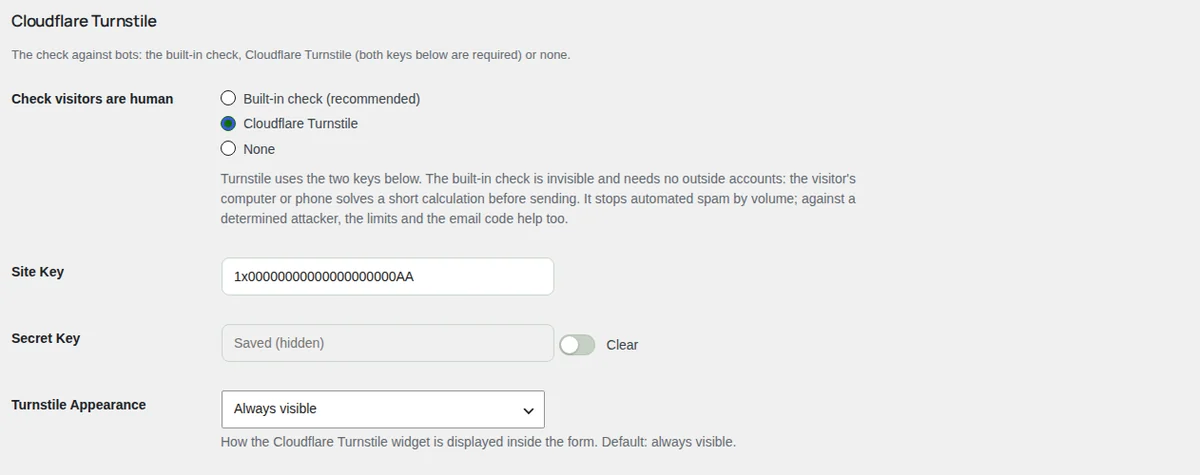
The check against bots: three options
Settings > Cloudflare Turnstile starts with "Check visitors are human":
- Built-in check (recommended): invisible and with no outside accounts. The visitor's computer or phone solves a short calculation before sending (well under a second on a normal phone). "Difficulty" (Low, Normal or High) sets how long it takes, and "Minimum seconds before sending" (2 by default, 0 = off) refuses answers sent faster than a person could. It stops automated spam by volume; against a determined attacker, the limits and the email code help too.
- Cloudflare Turnstile: the check described below, with its two keys. Without both keys, the built-in check is used.
- None: only the rate limits.
Sites from before version 1.4.0 that used Turnstile with both keys keep it; the rest move to the built-in check.
Turnstile is Cloudflare's free check against bots. With it, a script cannot run your tool in a loop and spend your AI credits, your verification credits and your server time. It is optional, and recommended on any public site. You do not need to have your site on Cloudflare.
Create the widget in Cloudflare
- Sign in at dash.cloudflare.com (a free account works) and open Turnstile.
- Add a widget. Give it a name, such as Email Health Chk, and add the domain of your site (for example
example.com). - Choose the Managed mode.
- Create it and copy the two keys: the Site Key and the Secret Key.
Paste the keys
- Open Email Health Chk > Settings > Cloudflare Turnstile.
- Paste the Site Key and the Secret Key. You need both: with only the site key, the box shows but nothing is checked.
- In Turnstile Appearance, choose Always visible (the default) or Invisible (show only when interaction is required).
- Press Save Changes.
Check it
Open the page with the tool in a private window and analyze a domain. The Turnstile box shows under the field (or not, in invisible mode) and the result arrives. Plugin Info shows the Turnstile tile as Configured.
How it is used
- The check runs on each analysis and on the request for a code. A visitor who passed it can ask for a code within the next 30 minutes without a new check, and a resent code needs none.
- Cloudflare also says which site the check was made on. If it is not your site, the plugin refuses it.
- If the check fails, the visitor sees "Bot-check verification failed. Please reload and try again." See If something does not work.
- To stop using Turnstile, choose "Built-in check (recommended)" or "None" in "Check visitors are human" and save.
Rate limits
Email Health Chk > Settings > Rate Limits (per minute) sets how often one visitor can use the tool, and how far one analysis goes. The limits count per IP address. A visitor over a per-minute limit sees "Too many requests. Please wait a moment and try again."
| Field | Default | What it limits |
|---|---|---|
| Analyses | 10 | Analyses per minute from one IP. |
| Briefings | 3 | Requests for a code per minute from one IP, and attempts to verify a code per minute. |
| Reports | 3 | Nothing at the moment: the plugin saves it but does not use it. |
| OTP sends | 5 | Codes per hour to one email address. Raise it to 10 or 20 while you test the report a lot. |
| OTP sends per visitor | 5 | Codes per hour from one IP, across all addresses. Stops one visitor from sending codes to many people. |
| Mail servers checked | 5 (1 to 20) | MX hosts analyzed per domain, by priority. Protects your server from domains with dozens of MX records. |
| Connection time budget | 30 seconds (5 to 120) | Total time for the SMTP and TLS connections of one analysis. Hosts left when it runs out are skipped. |
A visitor over the code limits sees "Too many codes requested. Please try again in an hour."
Press Save Changes after changing them.
Check scope, RBL list and DKIM selectors
Three blocks of Email Health Chk > Settings decide what the analysis looks at. The defaults work for almost every site.
Check Scope
A list of the twelve checks (SPF, DKIM, DMARC, MX, SMTP, TLS, Blacklists (RBL), MTA-STS, BIMI, DNSSEC, CAA and Web Server), each with an Enabled box and a short explanation. All come on.
In this version the boxes are saved but the analysis does not read them: every check runs even if you untick it. To leave the blocklists out, untick the lists in RBL List instead.
RBL List
The DNS blocklists the analysis queries for every IP of the mail servers. The plugin comes with twelve, eight of them on: Spamhaus ZEN, Barracuda, SpamCop, UCEPROTECT-1, UCEPROTECT-2, Mailspike, CBL and PSBL. SORBS, SURBL, URIBL and Invaluement come off.
- Tick or untick the box at the start of a row to use a list or not.
- To add a list, press Add RBL and fill in its name and its DNS zone (for example
dnsbl.example.com). - To remove a row, press its ×. A row without a name or a zone is not saved.
- Press Save Changes.
Every list you add is one more DNS query per IP, so the analysis takes a little longer. Some lists refuse queries from public DNS resolvers: the result then says they were not queried, never that the IP is clean.
DKIM Selectors
DKIM keys live at selector._domainkey.domain, and there is no public index of selectors. The plugin tries a list of the selectors of the large services: Microsoft 365, Google Workspace, Mailgun, SendGrid, Mailchimp, Postmark, Amazon SES, Brevo, Klaviyo, Zoho, HubSpot, Marketo, Salesforce and more.
- The field holds the list, separated by commas. Add your own selectors at the end.
- Each selector is one DNS query of about 50 ms. The full list adds a few seconds to a slow analysis. A shorter list is faster, but it finds fewer DKIM keys.
- Press Save Changes. To go back to the original list, empty the field and save: the field stays empty and the plugin uses its own list.
Lead capture and retention
A lead is the email address of a visitor who asked for the report or unlocked the usage wall, with the domain they analyzed and the number of findings by severity. You see them in Leads.
Lead Capture
In Email Health Chk > Settings > Lead Capture:
- Enable lead capture (on by default): saves the address as a lead when the visitor gets the report. Off, the confirmed address is used only to send the report and is then forgotten: no lead, no notification, nothing to Leads Chk. Turnstile, the code and the email verification still run, because they protect you from abuse.
- GDPR Retention (days) (90 by default, 0 to 3650): leads older than this are deleted every day, together with the record of the reports sent to them. 0 turns the deletion off. Use the same period your privacy policy promises.
Press Save Changes.
Lead capture also governs the usage wall: with it off, an address that unlocks the wall is not saved either, and fires no notification.
Privacy requests
The plugin works with the WordPress privacy tools (Tools > Export Personal Data and Tools > Erase Personal Data). One request for an email address exports or deletes everything the plugin keeps about it: the lead (domain, source, findings, IP, dates, times used) and the reports sent.
If you use Leads Chk
With Leads Chk installed and connected, each new lead also goes there, with its tags and consent record, and Leads Chk applies its own retention period. The leads in this plugin keep the period you set here.
Widget style
Email Health Chk > Settings > Widget Style chooses the look of the tool on your pages.
| Field | Default | What it does |
|---|---|---|
| Widget Style | Standard (neutral look) | Console (dark banner branding) puts the title on a dark band with a small monospace line above it, in the style of a terminal. |
| Console Eyebrow Text | ~ email health | The small line above the title, only with Console. |
| Console Accent Color | #5EEAD4 | The accent of Console: cursor, hover and focus ring. Write it as a hex color. |
The dark band takes the Primary color of Customize Widget, so Console looks best with a dark primary color. Press Save Changes and reload your page to see it.
Terms and conditions
Email Health Chk > Settings > Terms & Conditions adds a consent switch to the tool and to the report form, with your terms one click away. It is off by default.
Choose the mode
In Mode:
- Off (default): nothing is shown.
- Optional: the switch and the terms are shown, but the visitor can go on without turning it on.
- Required: the visitor must turn it on before they analyze or ask for the report. If they do not, they see "Please accept the terms & conditions to continue." (in the report form on its own, "Please accept the terms to continue."). The plugin checks it again on its server before it sends a code. Choose this one if your visitors may be in the European Union.
Write the texts
- Checkbox Label: the short text next to the switch. A new install fills in I agree to the Terms & Conditions and Privacy Policy. Empty, the switch reads "I agree to the terms & conditions."
- Privacy Policy URL (optional): the address of your privacy policy. It shows as the link "View full Terms & Conditions" at the end of the terms.
- T&C Body: the terms themselves. The plugin comes with a template in plain English (purpose, data collected, third-party services, no warranty, email verification, retention, acceptable use, changes). Edit it for your country or replace it. Paragraphs separated by a blank line are kept, and basic HTML is accepted. Reset to default template puts the template back in the box (it asks first if the box has text).
Press Save Changes.
What the visitor sees
Under the domain field, a switch with your label, a red asterisk when it is required, and "Read Terms & Conditions", which opens your text right there. The link to the full terms appears at the end when you set an address. "Read Terms & Conditions" only appears when the body or the address has something.
Usage wall settings
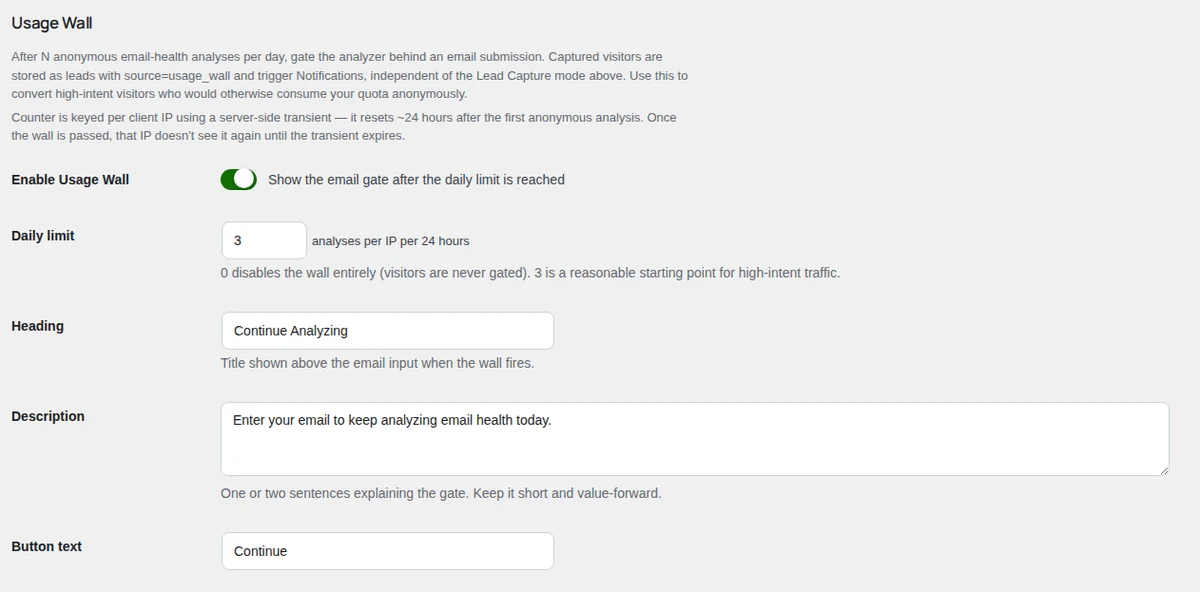
Email Health Chk > Settings > Usage Wall sets how many free analyses a visitor gets per day before the tool asks for their email. What the visitor sees is in The usage wall.
Turn it on
- Tick Enable Usage Wall (off by default).
- In Daily limit, set the free analyses per IP every 24 hours. The default is 3, a good start for most sites.
- Write the texts: Heading (default Continue Analyzing), Description (default Enter your email to keep analyzing email health today.) and Button text (default Continue). Keep the description to one or two short sentences.
- Press Save Changes.
Check what it needs
- A working AI provider. Unlocking the wall writes and sends the report for the domain, like the card under the results does.
- The code email reaching the visitor. Ask for one with your own address first.
- If you want Reoon or Emailit to check the addresses of the wall, tick Usage wall unlock in Email Verification. It is off by default.
Good to know
- The count is per IP address. Visitors behind the same office connection share it.
- An unlocked IP is free from the wall for 24 hours. Without unlocking, the count resets 24 hours after the last analysis that counted.
- The addresses captured by the wall are saved with the source
usage_wallonly when Lead capture is on. See Lead capture and retention.
Daily limit set to 0 does not turn the wall off in this version: it shows the wall on the very first analysis. To turn the wall off, untick Enable Usage Wall.
Floating button
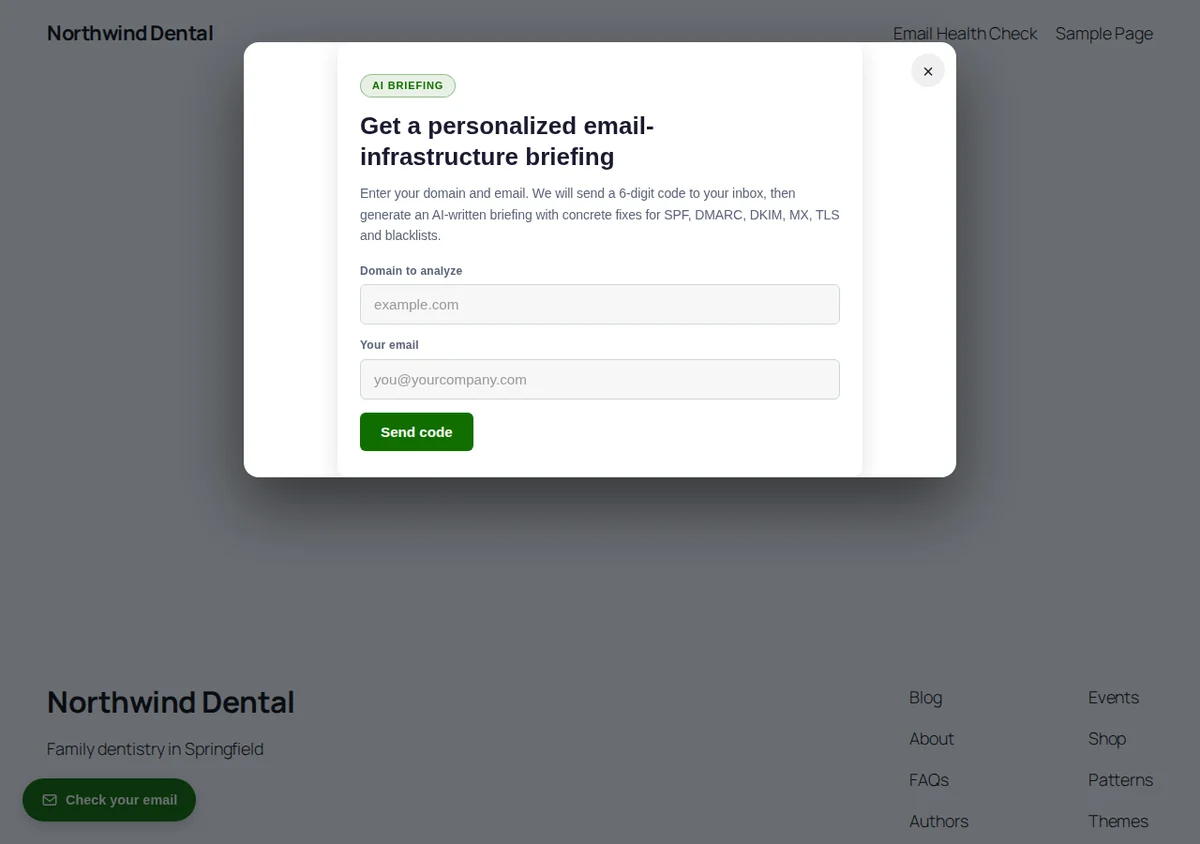
Email Health Chk > Settings > Global Popup / FAB adds a round button to a corner of every page (or of the home page only). It opens the report form in a window over the page: domain, email, code and report, without leaving the page. It needs no shortcode. It is off by default.
Turn it on
- Tick Enable (Inject the popup widget across the site).
- In Button Text, write the label of the button. Empty, it reads Check Email Health.
- In Button Side, choose Bottom-right corner (default) or Bottom-left corner.
- In Visibility, choose All pages (default) or Home page only.
- Press Save Changes and open your site in a private window.
Make it match your site
- Overlay Opacity: how dark the page gets behind the window, from 0 to 100 (default 60).
- FAB Background and FAB Text Color: the colors of the button. Empty, it uses the plugin's colors.
- FAB Icon: Shield (default), Search, Lock, Mail or Cog.
What the visitor sees
The button with its icon and label. A click opens the window with the three steps of the report form (see The tool on your site). The × button, a click outside the window or the Esc key closes it.
If another chat or button already sits in the same corner, put this one on the other side.
Customize Widget
Email Health Chk > Customize Widget changes the colors and the texts of the tool on your pages. On the right, Live Preview shows the tool with your changes a moment after you type. Nothing reaches your site until you press Save Changes.
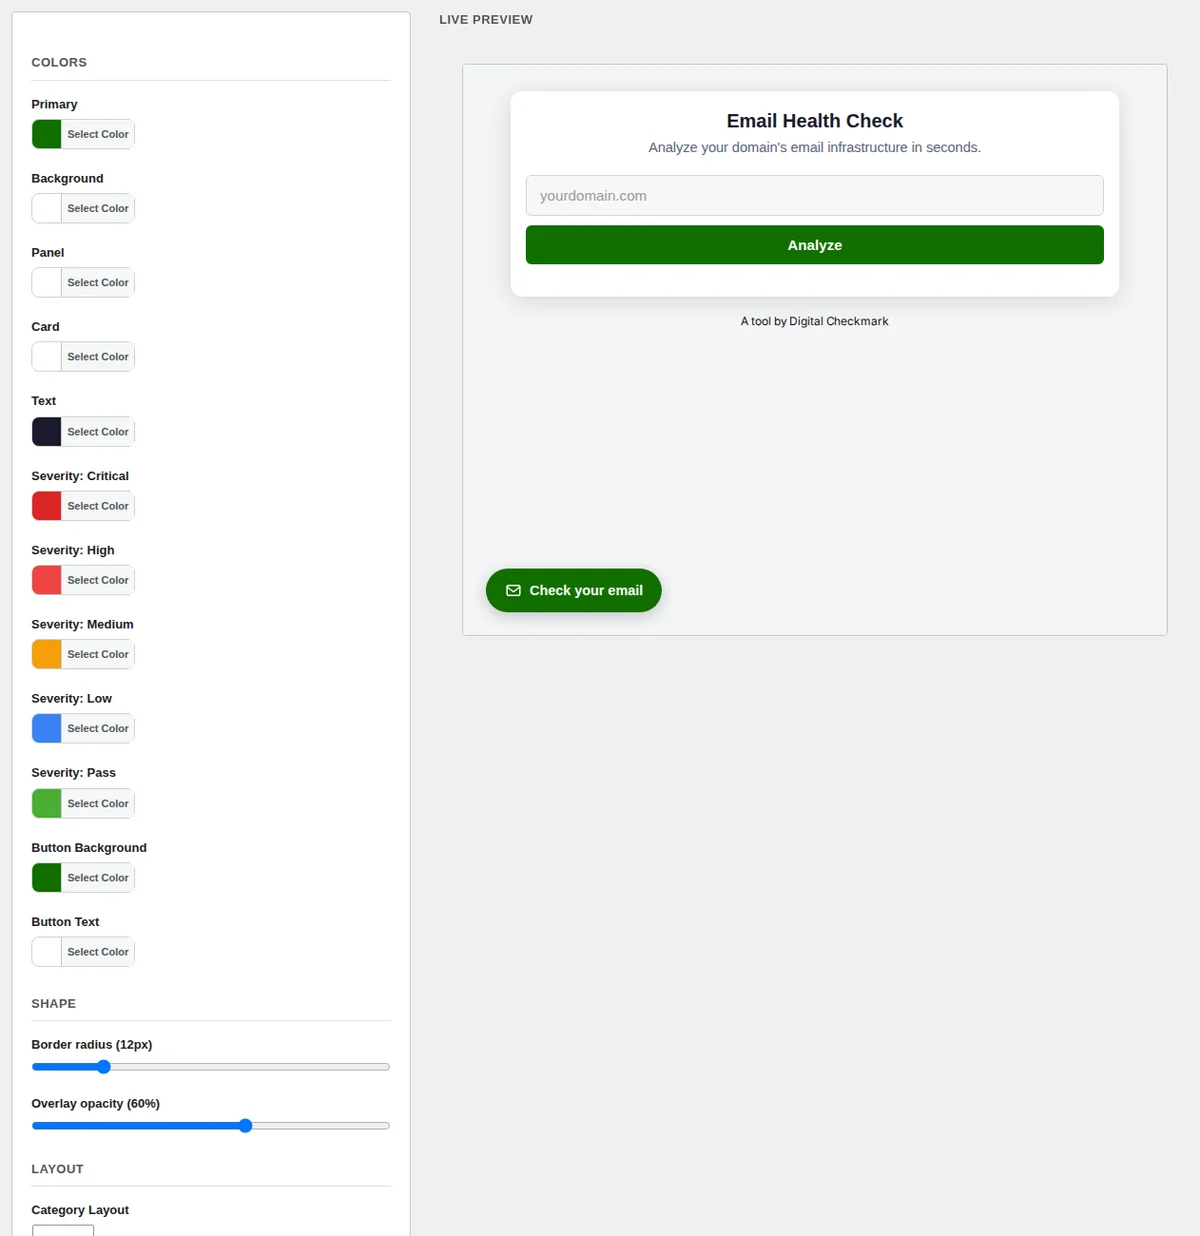
Colors
Twelve colors, each with a color picker. Empty, the plugin's own color is used.
- Primary: the main color (default
#126E00), also used by the "Analyze" button. It paints the dark band of the Console style too. - Background, Card and Text: the surfaces and the text of the tool.
- Severity: Critical, Severity: High, Severity: Medium, Severity: Low and Severity: Pass: the colors of each severity and of the checks that passed.
- Panel, Button Background and Button Text are saved but change nothing in this version: the button takes the Primary color.
Shape and layout
- Border radius: the roundness of the corners, from 0 to 64 px.
- Overlay opacity, Category Layout (Grid or List) and Show category icons belong to an older layout of the results and change nothing in the current one.
UI Text
The texts of the tool: Widget title, Widget subtitle, Domain placeholder (the gray example in the field), Analyze button, Loading text (shown while the analysis runs) and Error text (shown when the server cannot be reached).
A new install fills them in English. On a multilingual site, translate them in Languages > Translations (see Languages), or empty the title, the button and the loading text to use the plugin's own texts, already translated. An empty subtitle is not shown.
Brand Header HTML
Optional HTML shown above the tool, for example your logo: <img src="https://example.com/logo.png" alt="Northwind Dental">. Scripts and unsafe tags are removed.
Sales Pitch
Email Health Chk > Sales Pitch is the card that offers your help to the visitor who just saw their problems. It is off by default. Once on, the same card appears in four places:
- with the results on the page (or as a popup window),
- at the end of the report on screen, instead of the AI's "Ready to fix this?" paragraph,
- in the email that carries the report,
- in the PDF.
On the right, Live Preview shows the card as you type. Full-page preview (sandboxed iframe with HTML body rendered) opens a second preview with the body as HTML.
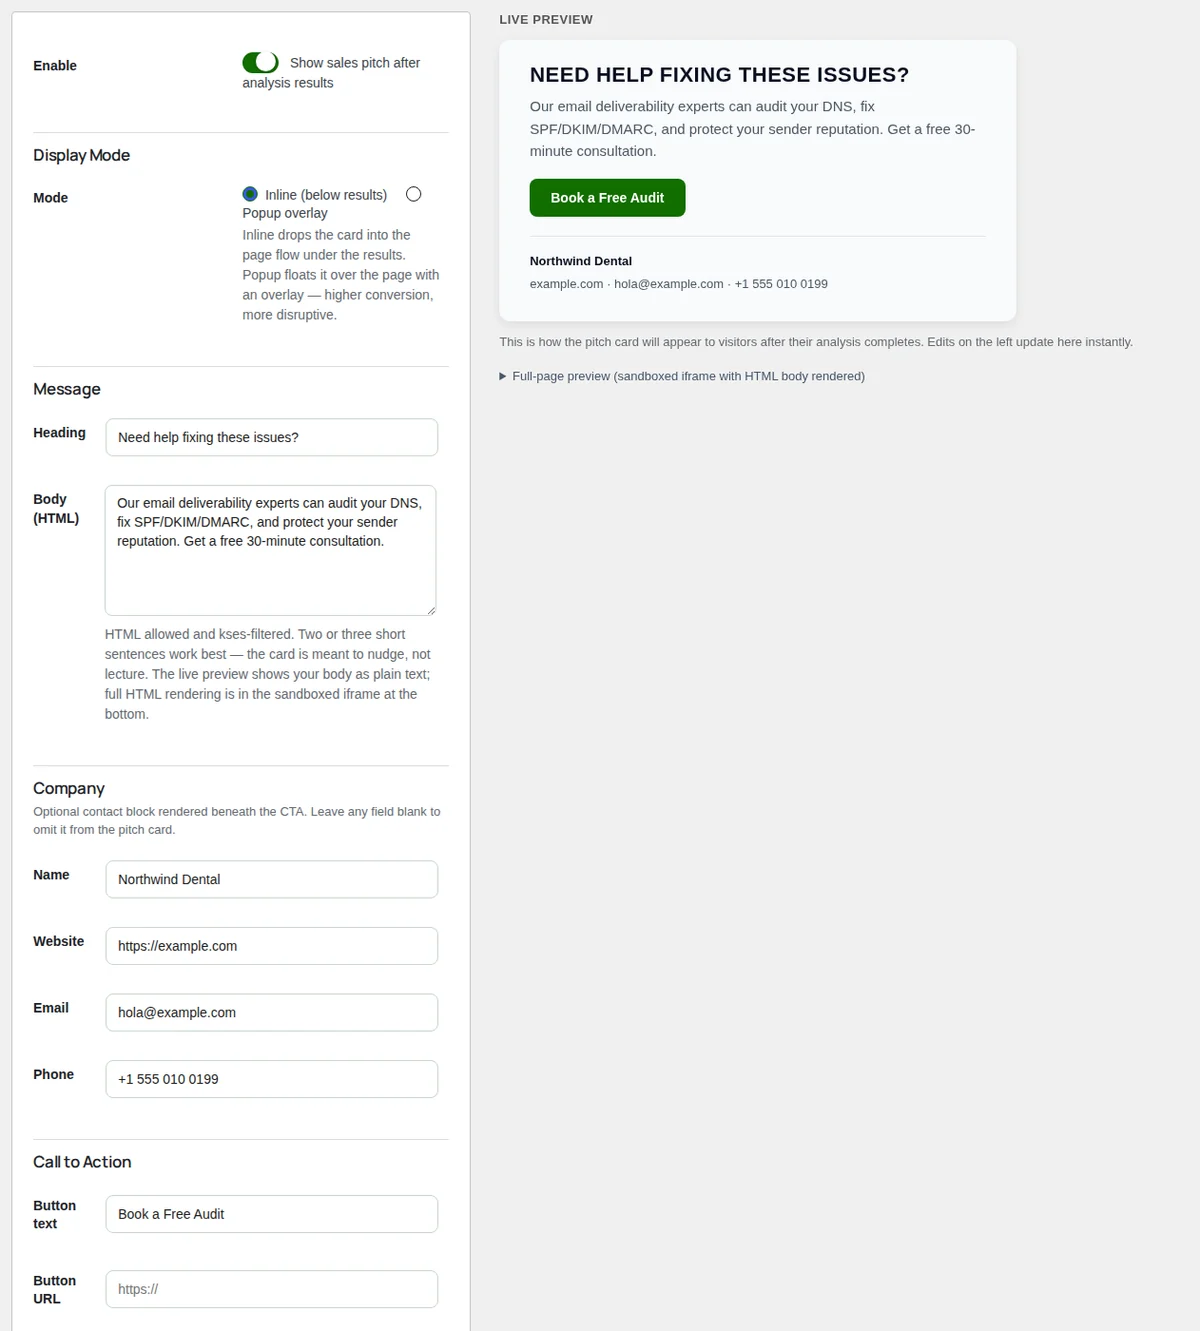
Turn it on and choose where
- Tick Enable (Show sales pitch after analysis results).
- In Display Mode > Mode, choose: - Inline (below results) (default): the card sits in the results, above the sections. - Popup overlay: the card floats over the page with a dark background. It converts more and interrupts more.
- With the popup, choose its Trigger: - Auto delay: it opens after Delay seconds once the results show (8 on a new install). - On scroll down: when the visitor scrolls past half of the page. - Exit intent (mouse leaves): when the mouse leaves the top of the window. - Manual only (CTA): only when your own button opens it (see below).
The popup only opens by itself on pages with the analyzer. The visitor closes it with the ×, a click outside or the Esc key.
Write the message
- Heading: default Need help fixing these issues?
- Body (HTML): two or three short sentences. Basic HTML is accepted. The live preview shows it as plain text.
- Call to Action: Button text (default Book a Free Audit) and Button URL, the page where you book the call or the contact form. Without a URL, the button goes nowhere: fill it in.
Add your company Optional
Under Company, fill in Name, Website, Email and Phone. They show under the button, as links. Leave a field empty to leave it out.
The Name is also the company shown at the top of every email the plugin sends (the code, the report and the alerts) and in the subject of the code email. Without it, the plugin uses your site name.
Pick the colors
Background, Heading, Body text, CTA button and CTA text. Choose a background that stands out from your site, and a strong color for the button.
Press Save Changes.
Open the popup from your own button
With Popup overlay and Manual only (CTA), any button of your theme can open the card with this code:
<button onclick="window.dispatchEvent(new Event('ehc-pitch-show'))">Talk to an expert</button>
Leads
Email Health Chk > Leads lists the visitors who confirmed their email to get the report or to unlock the usage wall. Each address appears once: when the same person comes back, its row is updated.
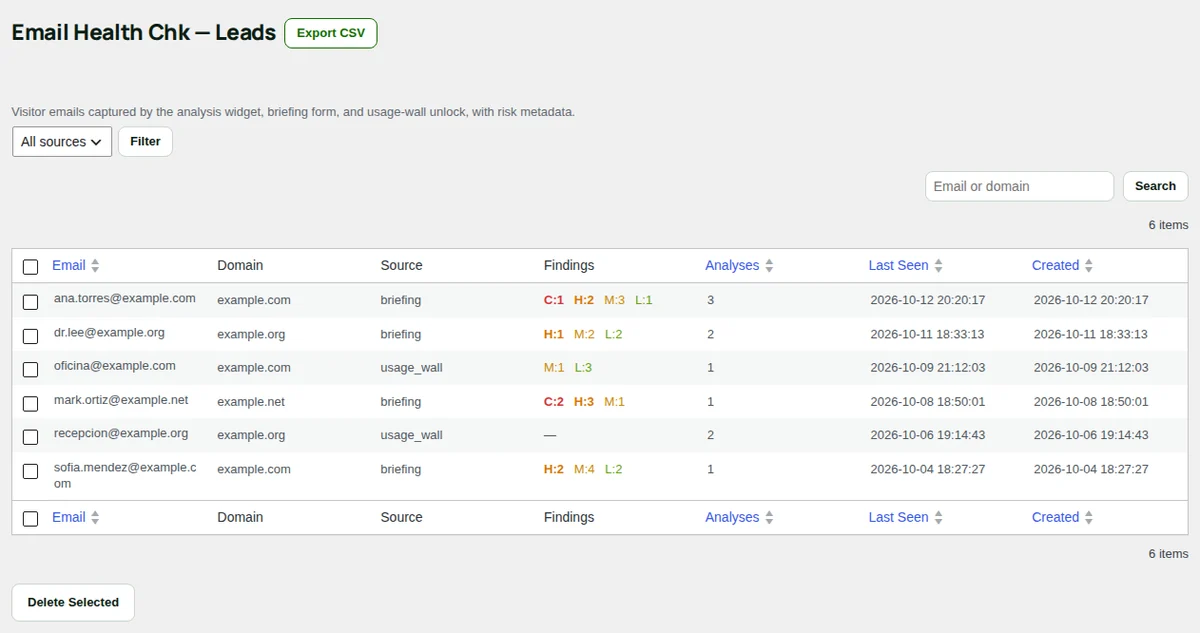
The columns
| Column | What it shows |
|---|---|
| The visitor's address. | |
| Domain | The last domain they analyzed. |
| Source | briefing (they asked for the report) or usage_wall (they unlocked the wall). A stronger source wins: a lead that once asked for the report stays briefing. |
| Findings | The findings of their last report by severity: C critical, H high, M medium, L low. A dash means none. |
| Analyses | How many times they confirmed their email. |
| Last Seen and Created | The last time and the first time, in UTC. |
Click Email, Analyses, Last Seen or Created to sort. The list shows 30 leads per page.
Find, filter and export
- Search finds a lead by email or domain.
- The source menu (All sources,
dashboard,usage_wall,briefing) and Filter show one source only. The plugin no longer saves leads with the sourcedashboard, so that filter only finds old leads. - Export CSV, next to the title, downloads the list as a CSV file (email, domain, source, the four counts, analyses, last seen and created). It respects the search. In this version it does not respect the source filter: it exports every source.
Delete
Tick the leads and press Delete Selected. The plugin asks for confirmation and then deletes them for good. Old leads are deleted on their own after the retention period of Settings > Lead Capture. See Lead capture and retention.
With Leads Chk connected, a notice at the top reminds you that Leads Chk already keeps every lead of this plugin. Both lists stay: this one is the plugin's own record.
Email Reports
Email Health Chk > Email Reports sets how the PDF looks and how the report email is sent. At the bottom, Live Cover Preview renders the real PDF template with a sample report (three problems, the records to publish and the action plan) for example.com. It updates a moment after each change. Scroll inside it to see the whole document. Press Save Changes to keep your changes.
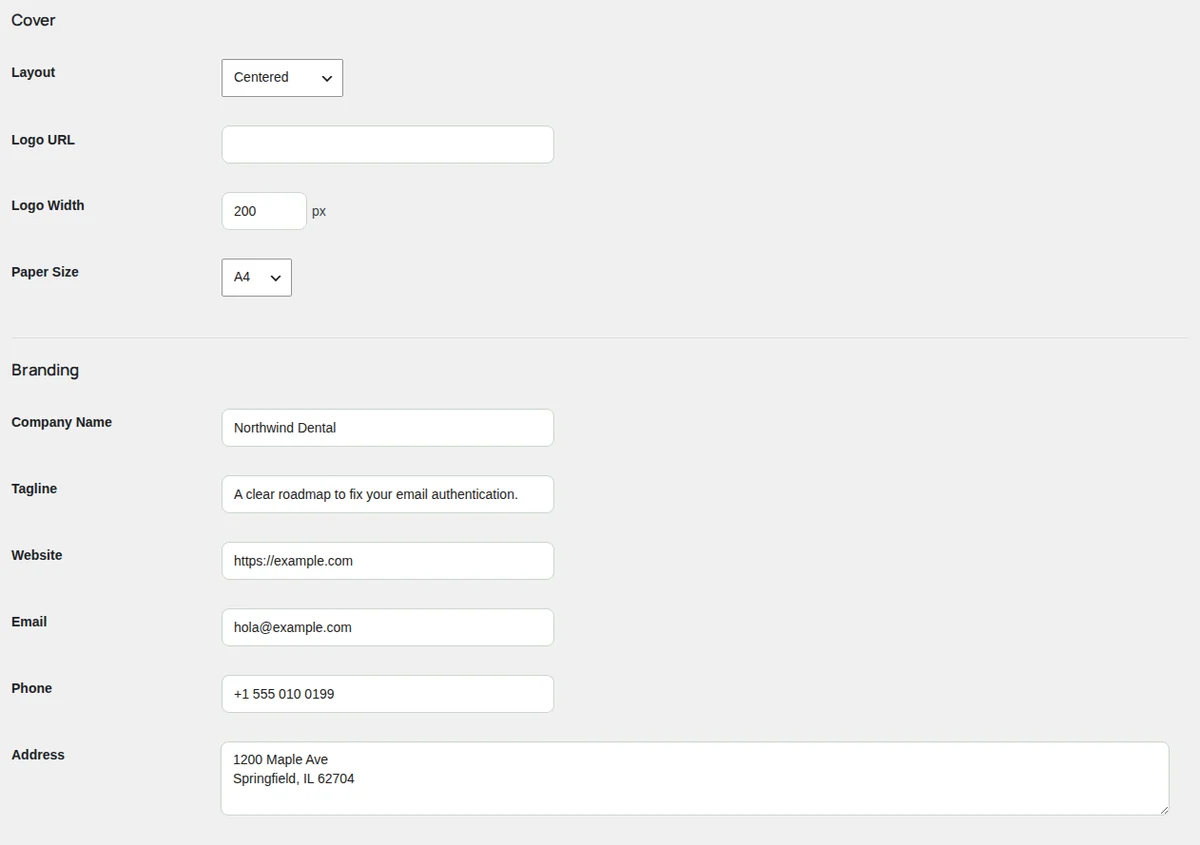
Cover
- Layout: Centered (default), Left aligned or Split (logo left).
- Logo URL: the address of your logo, for example from the Media Library. Use a PNG or JPG that is public on the internet.
- Logo Width: saved, but the PDF does not use it in this version.
- Paper Size: A4 (default) or Letter.
Branding
- Company Name: the name on the cover (default Email Health Briefing). Put your company's name.
- Tagline: the line under the name (default A clear roadmap to fix your email authentication.). It is translated with Polylang on a multilingual site.
- Website, Email, Phone and Address: saved, but the PDF does not show them in this version. Your contact details reach the visitor through the Sales Pitch.
Visual
- Primary Color: the accent of the PDF (default
#126E00). - Header Background and Header Text: the colors of the cover band.
- Footer Text: the line at the foot of every page.
{year}and{company}are replaced by the year and the company name.
Watermark
Optional, off by default. Tick Enabled (Show watermark on PDF) and choose the Type: Text, Image or Both. Then Text (default CONFIDENTIAL), Image URL, Opacity (5 to 50), Angle (-90 to 90 degrees), Size (20 to 120 pt) and Color.
Report options
- Attachment format: PDF (requires Gotenberg) (default) or HTML (no converter needed). HTML attaches the same document as an
.htmlfile, useful on shared hosting. Many mail gateways quarantine or strip.htmlattachments, so prefer PDF whenever you can. See PDF with Gotenberg. - AI closing CTA: the AI's "Ready to fix this?" paragraph at the end of the report (on by default). It only shows when the Sales Pitch is off. Untick it for a neutral report with no sales message.
SMTP Delivery
By default, the report goes out the way WordPress sends all its email (your SMTP plugin, if you have one). Fill in these fields to send the report through another server:
- Host and Port of your provider (587 by default).
- Encryption: TLS (default), SSL or None.
- Username and Password. The password is never shown again after saving.
- From Name and From Email: who the report comes from. Use an address of a domain with SPF and DKIM for that server.
- Press Save Changes and ask for a report with your own email.
The plugin uses this server only when Host, Username and Password are all filled in, and only for the report email. The verification codes and the alerts always go out through WordPress.
Notifications
Email Health Chk > Notifications alerts you when something happens: by email, by webhook (Microsoft Teams included) or with a daily or weekly summary. Each channel has its own events, sources and pause. Press Save Changes at the bottom: the screen says Notifications saved.
The events
| Event | When it fires |
|---|---|
| New lead | A visitor confirmed their email and got the report or unlocked the wall. Only with Lead capture on. |
| Critical finding | The same moment, when the report found at least one critical problem. It fires in addition to New lead. |
| Daily summary and Weekly summary | The summary of Email Digest, when you turn it on. |
If you tick no event in a channel, that channel sends all of them.
Alerts by email
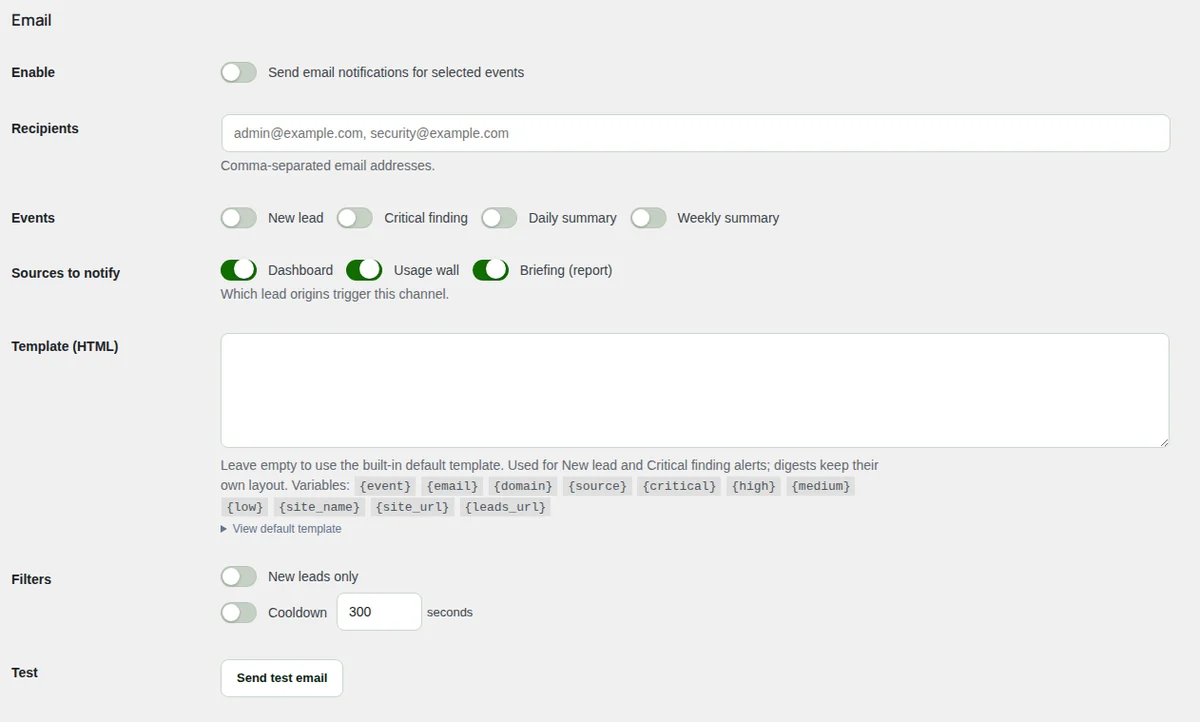
- Under Email, tick Enable (Send email notifications for selected events).
- In Recipients, write one or more addresses separated by commas.
- In Events, tick what you want to hear about.
- In Sources to notify, tick the origins that count: Dashboard, Usage wall and Briefing (report). All come ticked.
- Optional: in Template (HTML), write your own email for New lead and Critical finding. Empty, the built-in one is used (View default template shows it). Variables:
{event},{email},{domain},{source},{critical},{high},{medium},{low},{site_name},{site_url}and{leads_url}. The summaries keep their own layout. - Optional: under Filters, Cooldown pauses the channel for that many seconds after an alert of the same event (300 by default).
- Press Save Changes, then Send test email.
The alerts go out through WordPress, with your company at the top (see Sales Pitch).
Alerts by webhook
A webhook sends each event to another service (Zapier, Make, n8n, your own system) as a JSON POST with event, timestamp, site (name and address) and data (email, domain, source, counts and lead number).
- Under Webhook, tick Enable (Send webhook POST requests for selected events).
- In Webhook URL, paste the address the service gave you. Addresses on private networks are refused.
- Optional: in Custom Headers, one header per line as
Key: Value, for exampleAuthorization: Bearer your-token. - Tick the Events and the Sources to notify, and the Filters if you want them.
- Press Save Changes, then Send test webhook. The result shows next to the button.
Microsoft Teams
Teams receives the alerts as a card in a channel, through its Workflows app.
- In Teams, open the channel, press the three dots (…) next to its name and choose Workflows.
- Choose the template Send webhook alerts to a channel, give it a name and finish.
- Copy the address Teams shows at the end. It starts with
https://and haslogic.azure.comorpowerplatform.com. - Paste it in Webhook URL and follow the webhook steps above. The plugin recognizes it and sends a card instead of plain JSON.
The old Teams connector addresses (webhook.office.com) stopped working in May 2026: the plugin refuses them and says so.
The summary
Under Email Digest > Schedule, choose Disabled (default), Daily digest or Weekly summary. It goes to the Recipients of the email channel, and to the webhook if it is on, with the lead counts and the top findings of the period.
- The email channel must be on, with recipients.
- In Events, tick Daily summary or Weekly summary (or leave every event unticked).
- A period without new leads sends nothing.
What does not do anything yet
The New leads only box of Filters is saved, but in this version it does not filter anything: every alert is sent as if it were a new lead.
With Leads Chk connected, a notice at the top reminds you that Leads Chk can also alert you of new leads with its automations. Leave New lead off here if you use those, so you do not get two emails.
Email Verification
Email Health Chk > Email Verification decides how the plugin checks the addresses visitors give it, before it sends them a code or a report. Checking protects your sender reputation: codes sent to invented addresses bounce, and too many bounces put your domain on blocklists.
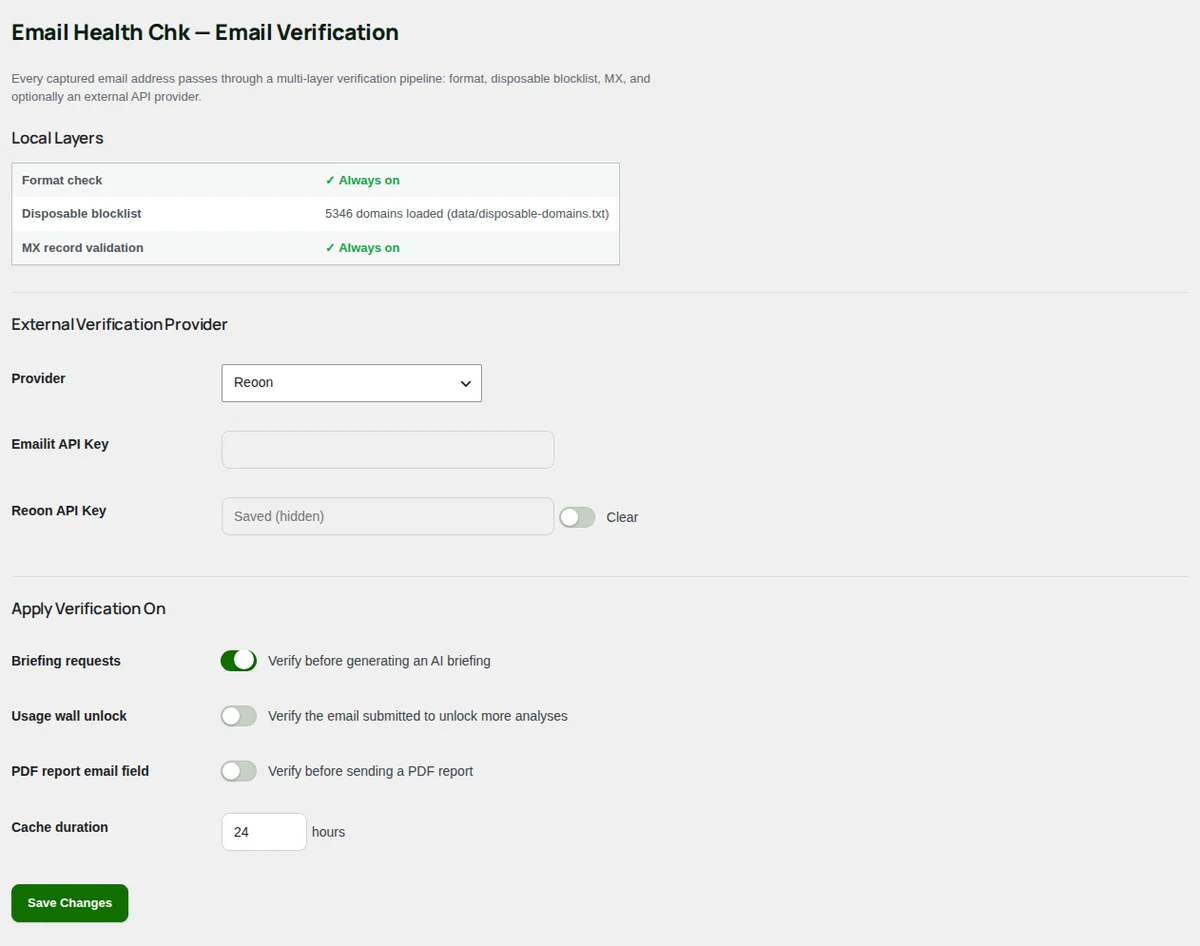
Local Layers
Three checks always run, for free, on every address:
- Format check: the address is well formed.
- Disposable blocklist: the domain is not a throwaway email service. The screen shows how many domains the list has.
- MX record validation: the domain of the address can receive email.
Before them, your rules of Allowed emails apply.
External Verification Provider
A paid service that confirms the mailbox exists. In Provider, choose None (format + MX + disposable only) (default), Emailit or Reoon, and paste its key in Emailit API Key or Reoon API Key. The key is never shown again after saving.
Get a Reoon key
- Create an account at reoon.com (Reoon Email Verifier) and buy or claim credits.
- Open the API section of your account and copy your API key.
- In Provider, choose Reoon, paste the key in Reoon API Key and press Save Changes.
The plugin uses Reoon's power mode, which checks the mailbox itself. It only refuses clear cases: invalid, disposable, disabled (when Reoon confirms it) and spam traps.
Or use Emailit
If you send with Emailit, its verification uses the same account. Create an API key in Emailit, choose Emailit and paste it in Emailit API Key. It refuses invalid, disposable and disabled addresses, gibberish and high-risk ones.
Apply Verification On
Choose where the provider is used. The local layers run everywhere anyway.
| Box | Default | When |
|---|---|---|
| Briefing requests | On | When a visitor asks for the report, before the code is sent. |
| Usage wall unlock | Off | When a visitor gives their email to unlock the wall. |
| PDF report email field | Off | Again right before the report email is sent. |
Cache duration keeps the provider's answer for an address so the same address does not spend another credit (24 hours by default). The field accepts up to 720 hours, but the plugin keeps the answer 168 hours (7 days) at most.
If the provider does not answer, runs out of credits or returns an error, the address passes. A provider failure never blocks your visitors. The reason goes to the Debug Log when it is on.
What the visitor sees
When an address is refused, the visitor sees why, for example "Please use a non-disposable email address." or "This email domain does not appear to accept email. Please use a valid address.", and no code is sent.
Allowed emails
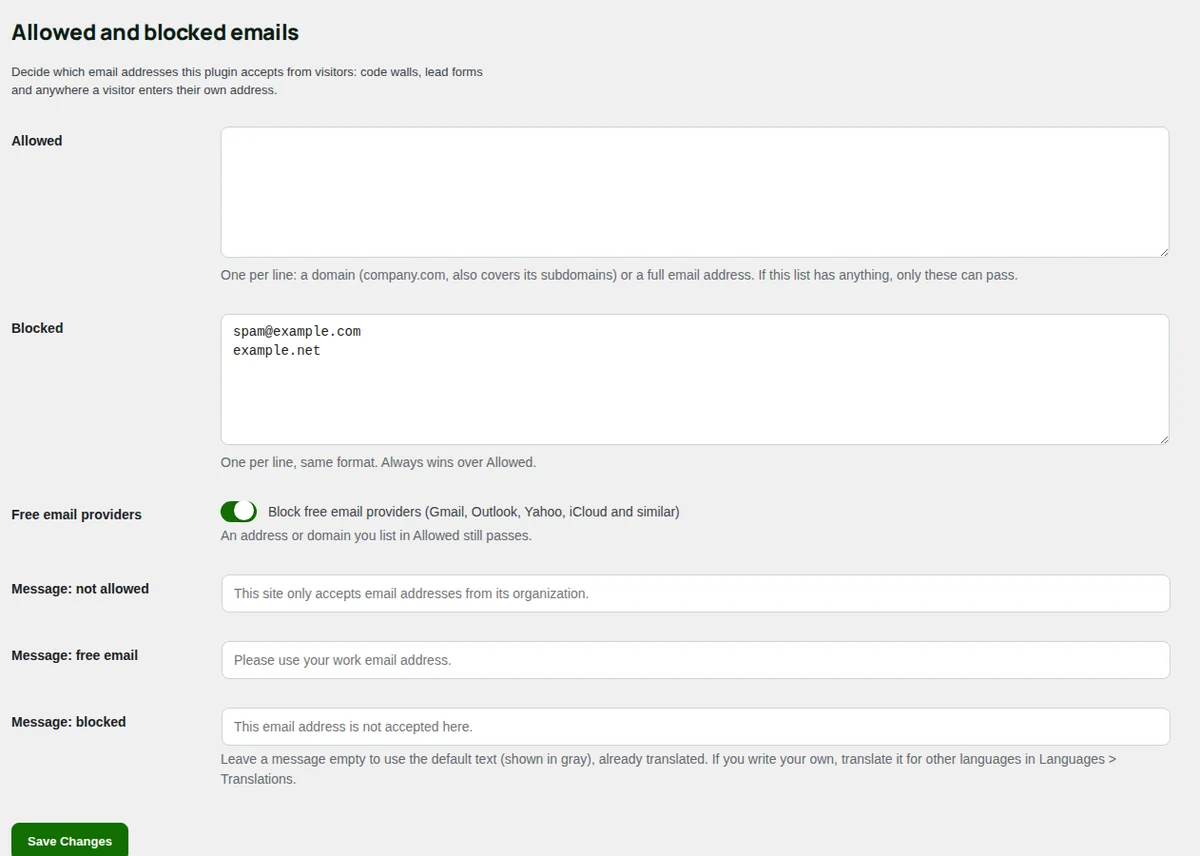
Email Health Chk > Allowed emails (the screen is titled "Allowed and blocked emails") decides which addresses the plugin accepts from visitors: in the report request, the usage wall and anywhere a visitor types their own address. It never applies to the domain being analyzed.
The lists
- "Allowed": one entry per line: a domain (
company.com, which also covers its subdomains) or a full address. If this list has anything, only these can pass. - "Blocked": same format. It always wins over Allowed.
- "Free email providers": tick "Block free email providers (Gmail, Outlook, Yahoo, iCloud and similar)" to ask for a work address. An address or domain you put in Allowed still passes.
Lines can also be separated by commas or semicolons. A line that is neither a domain nor an address is not saved, and the screen lists it after you save. Entries like *@company.com or @company.com are read as company.com.
For a blocked address, the plugin also catches its variants: ana+test@company.com counts as ana@company.com, and in Gmail the dots do not matter.
The messages
What the visitor reads when an address is refused. Empty, the built-in text is used, already translated:
| Field | Built-in text |
|---|---|
| "Message: not allowed" | "This site only accepts email addresses from its organization." |
| "Message: free email" | "Please use your work email address." |
| "Message: blocked" | "This email address is not accepted here." |
Each message can be up to 300 characters. If you write your own, translate it in Languages > Translations (group Email Health Chk).
Press Save Changes.
Integrations (Leads Chk)
Email Health Chk > Integrations connects the plugin with Leads Chk, the Digital Checkmark plugin that gathers the contacts of all the tools in one place, with their origin, their consent, lists and newsletters. Without Leads Chk, the screen only says how to get it, and the leads stay in this plugin's own Leads.
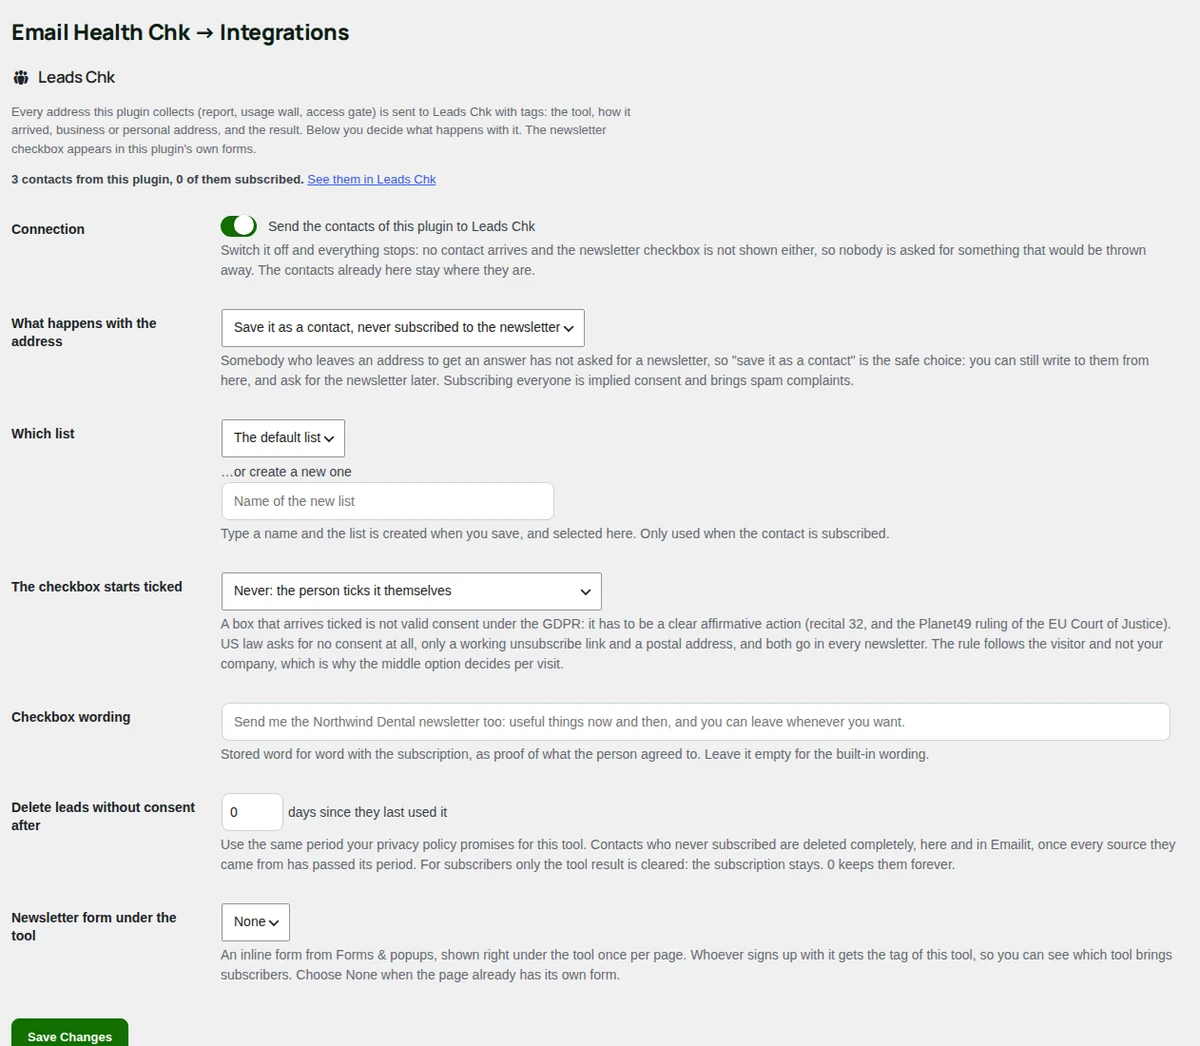
What is sent
Every new lead (report, usage wall) goes to Leads Chk with tags: the tool (tool:email-health-chk), how the address arrived (via:briefing or via:usage_wall), whether it is a business or a personal address, and risk:critical or risk:high when the report found such problems. Addresses confirmed with a code skip the double opt-in. The lead stays in this plugin too.
At the top, the screen counts the contacts that came from this plugin and how many are subscribed, with a link to see them in Leads Chk.
Install Leads Chk
Install and activate Leads Chk. Then open Email Health Chk > Integrations. The fields below come from Leads Chk, in the language of your admin.
Decide what happens with each address
- Connection: tick Send the contacts of this plugin to Leads Chk. Off, nothing is sent and the newsletter checkbox is not shown.
- What happens with the address: Save it as a contact, never subscribed to the newsletter (the safe choice), Save it, and offer the newsletter with a checkbox, or Save it and subscribe it to the newsletter. Someone who asks for a report has not asked for a newsletter: subscribing everyone brings spam complaints.
- Which list: the list for those who subscribe, or a new one.
- With the checkbox: The checkbox starts ticked (never, everywhere except Europe, or always) and Checkbox wording. A box that arrives ticked is not valid consent in the European Union.
- Delete leads without consent after: the days Leads Chk keeps a contact that never subscribed. Use the period of your privacy policy.
- Newsletter form under the tool: a Leads Chk form shown under the tool, or None.
- Press Save Changes. The screen says Saved.
The newsletter checkbox appears in the plugin's own forms: the report request and the usage wall.
Under the report request, the tool tells the visitor One-time email, no marketing list, and that line has no setting. Subscribing everyone to your newsletter goes against it: prefer the first or the second option.
Debug Log
Email Health Chk > Debug Log shows what the plugin writes about its errors: the AI, Gotenberg, Turnstile, email verification, notifications and sending. Turn it on when something fails, reproduce the problem and read the last lines.
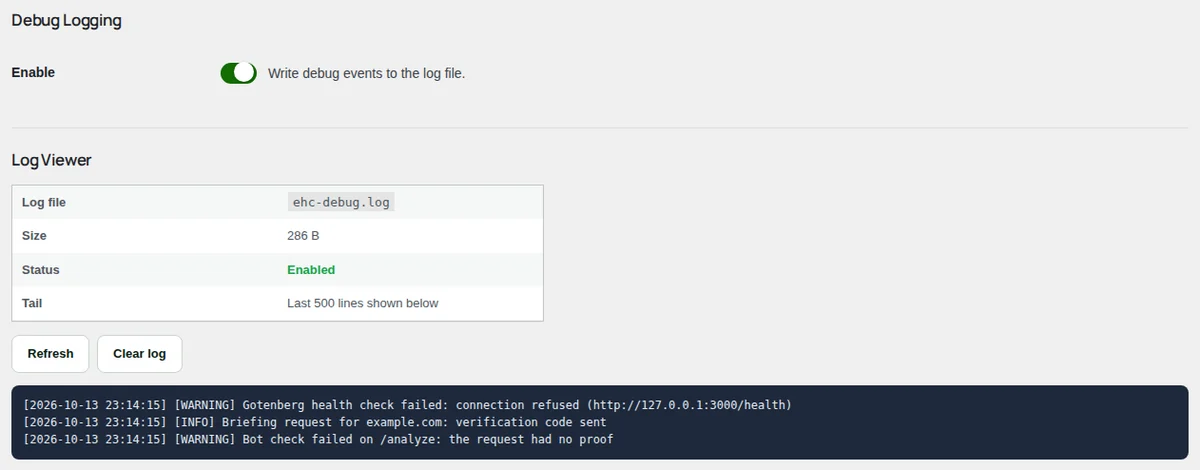
Turn it on
Tick Enable (Write debug events to the log file.). It saves at once. It is the same switch as Settings > Debug. Off (the default), the plugin writes nothing, not even errors.
Read it
The table shows the Log file name, its Size, its Status and that the last 500 lines are shown below. Refresh reloads the lines without leaving the page. Clear log empties the file (it asks first).
The file lives in a protected folder of your uploads directory, with a name nobody can guess. When it reaches about 500 KB, the plugin starts a new one and keeps the previous one.
Turn the log off when you are done: it can hold visitors' addresses and domains.
When the plugin is deleted
At the bottom, "When the plugin is deleted" decides what happens if you delete the plugin from the Plugins screen. Turning it off never deletes anything.
- "Delete all its data too" off (default): settings, leads and logs stay, so a new install picks up where you left.
- On: its tables, settings, logs and files are removed for good, and the license is released if it has one.
Press "Save" under the box.
Plugin Info
Email Health Chk > Plugin Info is the plugin's summary page: how to use it, what is configured, the license and the versions. Nothing here changes how the tool works, except the license.
How to Use
The shortcodes and their use: [email_health], [email_health mode="briefing"], the floating button, the Sales Pitch and the code that opens its popup. See The tool on your site.
Subsystem Status
One tile per service, with a Configure button that opens its screen:
| Tile | Green when |
|---|---|
| AI Provider | The chosen provider has its key (and, for a custom service, its address). |
| Gotenberg | Its address answers (Reachable). The answer is kept for 5 minutes. |
| Bot check | Which check is on: Built-in check, Cloudflare Turnstile or None. |
| SMTP | Email Reports has a host and a sender address. |
| Email Verification | A provider is chosen and has its key. |
| License | The license is active. |
| Debug Log | The log is on. |
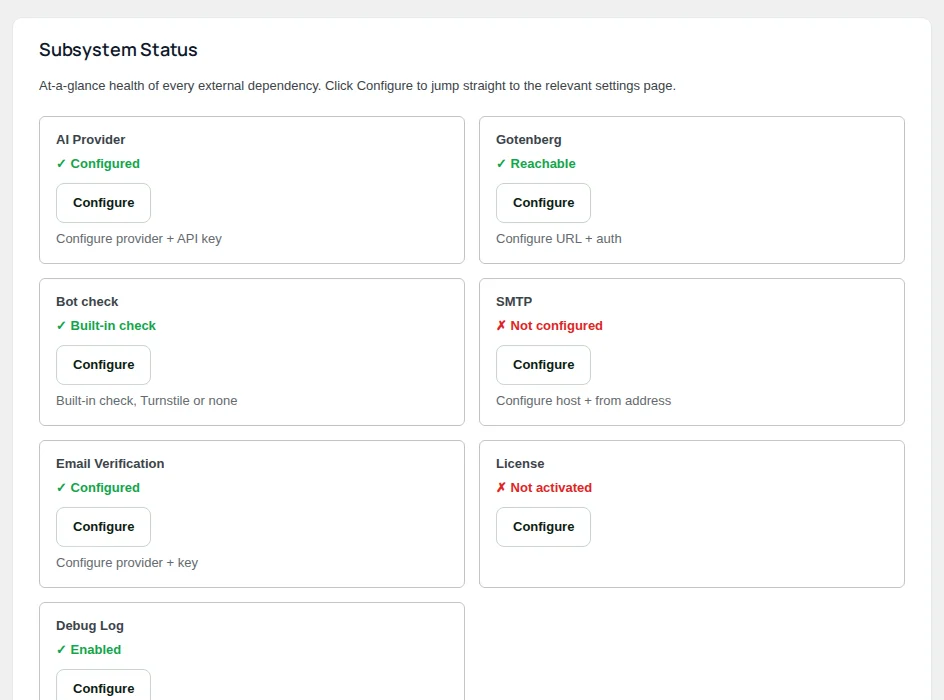
The SMTP tile turns green with a host and a sender, but the plugin only uses that server when the username and password are filled in too. A grey or red tile is not always a problem: SMTP and Email Verification are optional.
License
Paste your license key and press Activate to mark this site as activated, or Deactivate to free it for another site. In this version the license blocks nothing: the plugin works the same without it.
Environment and the rest
Environment lists the plugin, PHP and WordPress versions and the total of leads, useful when you ask for help. Documentation & Support links to this guide and to support, and repeats that the line "A tool by Digital Checkmark" has no setting. Multilingual says whether Polylang is active and where to translate your texts. Leads Chk shows whether it is installed and connected, what it receives and where to change it.
If something does not work
Start with Email Health Chk > Plugin Info > Subsystem Status, then turn on the Debug Log and repeat what failed.
The tool loads but the analysis never arrives
PDF report email field
in Email Verification: when on, an address the provider refuses gets no email.
"Bot-check verification failed. Please reload and try again."
The Turnstile check did not pass on the server. Check that the secret key belongs to the same widget as the site key, and that the widget lists your site's domain. The log says the reason (for example a domain that does not match).
The report fails after the code
- "The analysis service is not configured. Please contact the site administrator.": there is no AI key, or the custom service has no address or key. See AI provider.
- "The analysis service is currently unavailable. Please contact the site administrator.": the AI refused the request. Check the key, the model and your credits. Set a backup AI.
- "AI provider returned a malformed response. Please try again.": the AI answered something that is not a report. Try again, or choose another model.
- "The request took longer than 60 seconds. The email service or AI provider may be slow right now. Please try again in a moment.": choose a faster model, or set Thinking level to
lowwith Gemini.
The report shows on screen but no email arrives
The screen always says the report was sent, even when the email failed. Check, in this order:
- Gotenberg: Plugin Info must say Reachable. If it does not, see PDF with Gotenberg, or switch to HTML in Email Reports.
- PDF report email field in Email Verification: when on, an address the provider refuses gets no email.
- How your site sends email: try the alerts with Send test email in Notifications. If that does not arrive either, set up SMTP for WordPress or in Email Reports.
- The visitor's spam folder.
The code does not arrive
The code goes out through WordPress, not through the SMTP of Email Reports. If WordPress cannot send email, nothing arrives: install an SMTP plugin. Ask the visitor to look in spam, and to wait: the code lasts 10 minutes.
"Too many codes requested. Please try again in an hour."
One address or one visitor asked for more codes than OTP sends or OTP sends per visitor allow. Raise them while you test. See Rate limits.
A blocklist says it was not queried
That is expected when your server uses a public DNS resolver: Spamhaus, CBL and others refuse those queries. The report says so instead of calling the IP clean. Use your own resolver on the server to query them.
"No DKIM detected" for a domain that signs
The domain uses a selector that is not in the list. Add it in Settings > DKIM Selectors. See Check scope, RBL list and DKIM selectors.
The report is in the wrong language
The report follows the language of the page where the visitor asked for it. Check that your multilingual plugin gives each page its language, and translate your own texts in Languages > Translations. See Languages.
The usage wall shows on the first analysis
Daily limit is set to 0. Set it to the number of free analyses you want. See Usage wall settings.
Getting help
Write to us through the support page. To help us answer fast, include:
- the plugin version, and your WordPress and PHP versions (all in Plugin Info > Environment);
- the domain you analyzed and the exact text of the message;
- the last lines of the Debug Log around the problem, with the log turned on while it happened.
Do not send us your API keys or passwords.
Go to support